The world of crypto trading often feels like a wild, untamed ocean. Prices surge and plummet in unpredictable waves, leaving many traders feeling tossed about by the currents. One moment, a coin is rocketing to the moon; the next, it’s in a deep correction. Navigating these volatile waters requires more than just luck; it demands a keen eye for patterns and a disciplined strategy.
But what if you could learn to read these market movements, anticipate reversals, and make more informed decisions? What if you had a compass and a map for this exhilarating journey?
This is precisely where understanding chart patterns becomes crucial, and where platforms like MEXQuick empower you. Designed for smarter, pattern-based trading, MEXQuick provides innovative tools like Rhythm Trading and Event Trading to help you identify critical chart movements early, giving you an edge in a fast-moving market.
In this guide, we’ll dive deep into one of the most reliable and sought-after patterns in technical analysis: the W pattern crypto chart. We’ll explain what it is, how it works in the dynamic crypto market, and, most importantly, how you can use MEXQuick’s insights and tools to spot and trade it effectively, turning market chaos into calculated opportunity.

What Is the W Pattern in Crypto Trading?
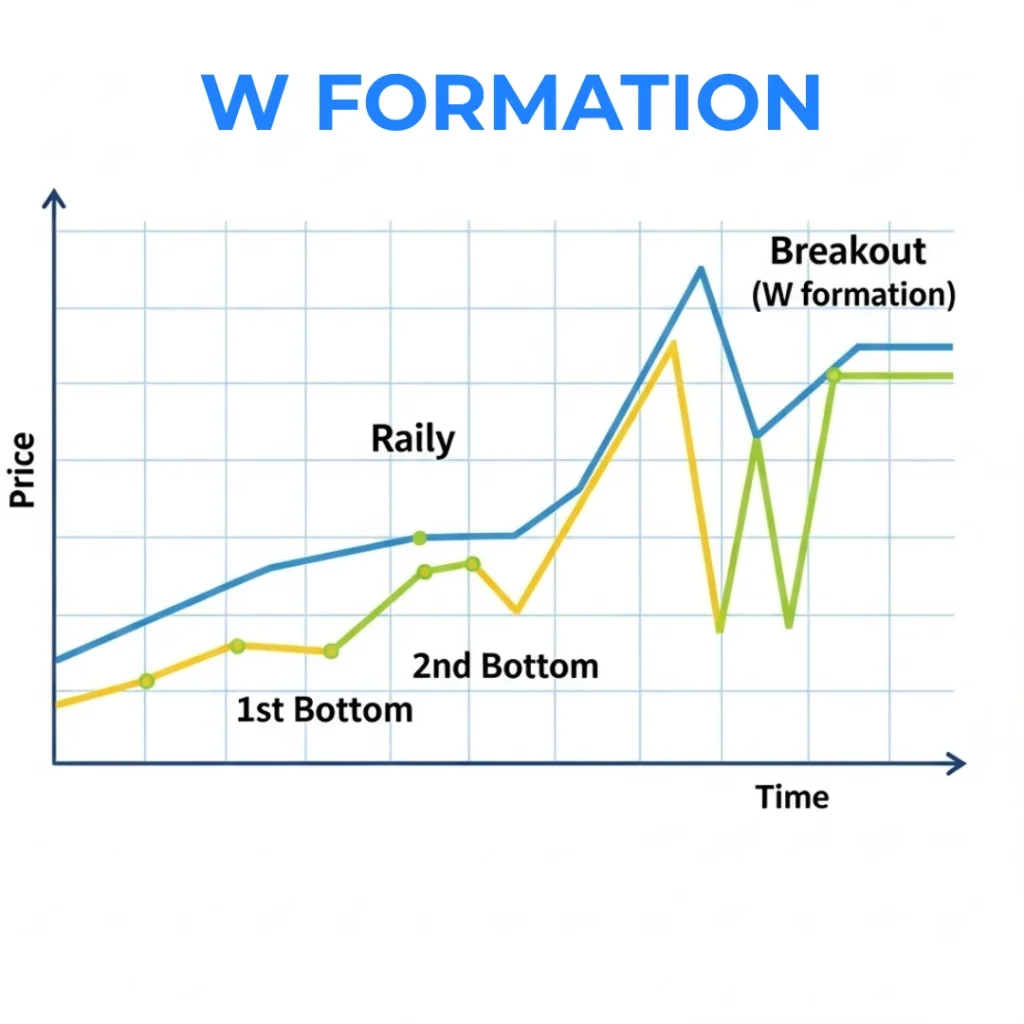
Let’s keep it simple: The W pattern, often referred to as a “Double Bottom” pattern, is a bullish reversal chart pattern that visually resembles the letter “W.” Its significance lies in its powerful signal: it indicates that a downtrend is likely coming to an end, and a new upward movement (a bullish trend) is about to begin.
Imagine a cryptocurrency that has been steadily falling in price. Suddenly, it finds strong support, bounces up slightly, falls back down to test that same support level (or a very similar one), and then decisively breaks upwards. This creates two distinct “bottoms” at roughly the same price level, separated by a peak in between – forming that characteristic “W” shape.
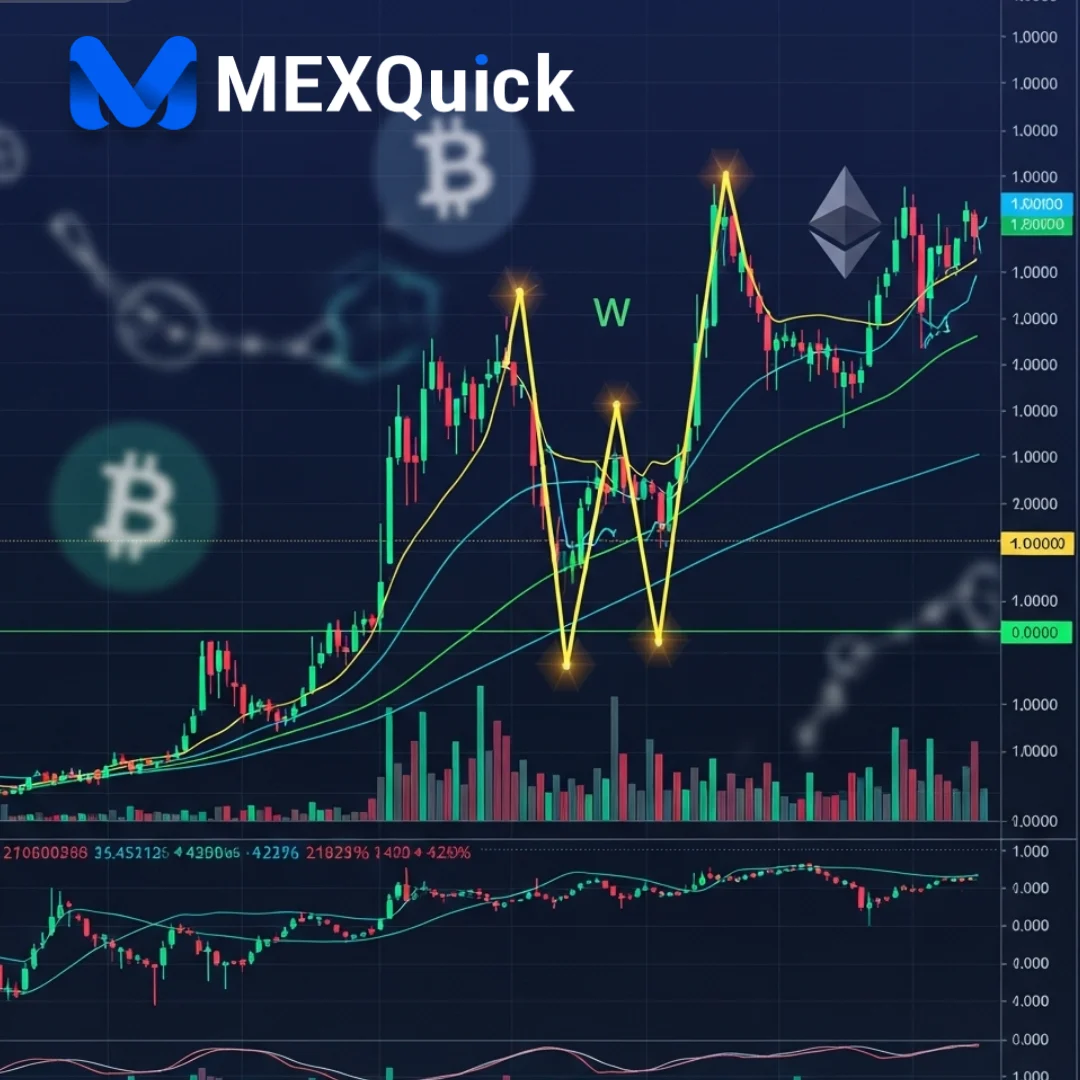
In the crypto market, this pattern frequently appears in popular and high-liquidity coins like Bitcoin (BTC), Ethereum (ETH), Solana (SOL), and various altcoins, especially after significant market corrections or prolonged bearish periods. It’s a testament to demand stepping in at a certain price point, suggesting that sellers are exhausted and buyers are gaining control.
How the W Pattern Forms
Understanding the formation stages is key to accurately identifying and trading the W pattern. It’s a narrative of price action battling out supply and demand:
- Downtrend and First Bottom: The asset is in a clear downtrend, with lower lows and lower highs. Eventually, it reaches a price level where selling pressure temporarily exhausts, and buying interest steps in, causing a bounce. This marks the first “bottom” of the “W.”
- Temporary Rally (The Middle Peak): After hitting the first bottom, the price experiences a modest upward rally. This rally usually doesn’t signal a full trend reversal yet, as it’s often followed by renewed selling pressure. This peak forms the middle part of the “W,” and its highest point defines what technical analysts call the “neckline” of the pattern.
- Second Bottom (Testing Support): The price then falls again, typically retesting the previous support level (the first bottom) or coming very close to it. Crucially, the price should not fall significantly below the first bottom. This retest confirms the strength of the support level, indicating that buyers are still present at that price point. This forms the second “bottom” of the “W.”
- Breakout and Trend Reversal: This is the most critical stage. After forming the second bottom, the price begins to rally again, this time with more conviction. The W pattern is considered confirmed when the price breaks decisively above the neckline (the high point of the temporary rally between the two bottoms) and sustains that upward movement.
Emphasizing Confirmation: It’s vital to stress the importance of volume confirmation and breakout validation before entering a trade. When the price breaks above the neckline, ideally, you want to see a significant surge in trading volume. This increase in volume confirms that strong buying pressure is backing the breakout, making the reversal more reliable. A “false breakout” (where price briefly goes above the neckline but then falls back down) is a common trap beginners fall into. Patience is a virtue here.
Why the W Pattern Matters for Crypto Traders
In the high-stakes arena of cryptocurrency trading, volatility is a double-edged sword. While it offers immense profit potential, it also amplifies risks. This makes pattern recognition a key trading skill. Identifying patterns like the W formation can provide:
- Early Reversal Signals: It gives traders an early heads-up that a downtrend is losing momentum and a bullish reversal is likely, allowing for timely entry.
- Defined Risk and Reward: The pattern provides clear levels for entry, stop-loss, and profit targets, facilitating better risk management.
- Increased Confidence: Trading based on well-established patterns reduces emotional decision-making and fosters a more disciplined approach.
MEXQuick’s innovative trading tools are specifically designed to help users track market rhythm and event-based changes that often precede or coincide with W pattern formations. Our platform’s advanced charting and analytical capabilities empower you to spot these critical shifts before they become obvious to the casual observer.
At MEXQuick, we believe that mastering chart patterns like the W pattern gives traders the confidence to trade smarter — not just faster. It’s about making informed, strategic moves rather than impulsive reactions to market noise.
How to Trade the W Pattern on MEXQuick
Trading the W pattern effectively requires a structured approach. Here’s a simple, step-by-step guide on how you can leverage MEXQuick’s platform to identify and execute these trades:
- Identify the Pattern – Use MEXQuick’s Charting Tools:
- Log into your MEXQuick account and navigate to the charting interface for your chosen crypto asset (e.g., BTC/USD, ETH/USDT).
- Look for a clear downtrend followed by two distinct lows at approximately the same price level, separated by a peak. Use different timeframes (e.g., 1-hour, 4-hour, daily) to confirm the pattern’s validity. MEXQuick’s intuitive charts allow for easy toggling between timeframes and drawing tools to outline the potential W.
- Wait for Confirmation – Validate the Breakout:
- The W pattern is only confirmed when the price breaks decisively above the “neckline” (the highest point of the rally between the two bottoms).
- Crucially, observe the trading volume on MEXQuick’s charts. A strong increase in buying volume accompanying the breakout significantly strengthens the pattern’s reliability. Avoid entering on weak volume breakouts, which are often false signals.
- Set Entry & Stop-Loss Levels – Manage Your Risk:
- Entry: Once the price has clearly broken and sustained above the neckline with confirming volume, you can consider entering a long (buy) position. Some traders wait for a retest of the neckline as new support after the breakout before entering.
- Stop-Loss: Place your stop-loss order strategically below the second bottom of the W pattern. This ensures that if the pattern fails and the price drops further, your potential losses are limited. MEXQuick’s advanced order types make setting these levels simple and quick.
- Plan Your Target – Calculate Potential Profit:
- A common method for setting a profit target is to measure the vertical distance from the lowest point of the “W” (either bottom) to the neckline. Then, project this same distance upward from the breakout point (the neckline). This gives you an estimated price target.
- Example: If the distance from the bottom to the neckline is $100, and the breakout occurs at $1000, your target would be $1100.
- Manage Risk & Monitor – Use MEXQuick’s Real-time Alerts and Analysis:
- Even with a confirmed pattern, continuous monitoring is essential. Use MEXQuick’s real-time alerts to notify you of price movements.
- Our built-in analysis tools can help you track other indicators (like RSI or MACD) to confirm the strength of the bullish momentum and protect your profits as the trade progresses. Don’t be afraid to take partial profits as the price moves towards your target.
Common Mistakes in Trading the W Pattern
Even reliable patterns can be misread or mismanaged. Beginners often fall into these traps:
- Entering Before Confirmation (False Breakouts): This is the most common mistake. Traders jump in as soon as they see two bottoms, without waiting for the price to break above the neckline with significant volume.
- Ignoring Volume Signals: A breakout without increased volume is a red flag and often leads to failed patterns. Volume confirms the conviction behind the price movement.
- Over-Leveraging in Volatile Markets: Applying high leverage to W pattern trades, especially in the highly volatile crypto market, can lead to quick liquidations if the market makes an unexpected move or you encounter a false breakout.
- Failing to Combine W Pattern with Other Indicators: Relying solely on one pattern is risky. Successful traders use confluence – combining the W pattern with other technical indicators like RSI (Relative Strength Index) for momentum or MACD (Moving Average Convergence Divergence) for trend strength to get a more robust signal.
- No Stop-Loss or Poor Stop-Loss Placement: Not setting a stop-loss, or placing it too close to your entry, can lead to unnecessary losses. The stop-loss should be placed logically, typically below the pattern’s confirmed support.
MEXQuick’s built-in analysis tools, custom alerts, and advanced order types are designed to help traders avoid these common errors. Our platform promotes a disciplined approach, encouraging you to wait for validation and manage risk transparently.
W Pattern vs. Other Chart Patterns
While the W pattern signals a bullish reversal, it’s part of a larger family of chart patterns. One of its closest relatives, and its exact opposite, is the M pattern (or Double Top).
- W Pattern (Double Bottom): Signals a bullish reversal after a downtrend. It looks like a “W” and indicates that support is holding, leading to an upward trend change.
- M Pattern (Double Top): Signals a bearish reversal after an uptrend. It looks like an “M” and indicates that resistance is holding, leading to a downward trend change.
Recognizing both the W pattern and the M pattern helps traders anticipate trend changes in both directions, allowing them to adapt their strategies whether the market is turning bullish or bearish. Mastering these fundamental patterns builds a powerful foundation for technical analysis.
We encourage readers to explore MEXQuick’s comprehensive educational resources and leverage our Rhythm Trading features. Rhythm Trading is specifically designed to help you identify repeating cycles and patterns, making the mastery of setups like the W and M patterns an intuitive part of your trading process.
Final Thoughts – Trade Smarter with MEXQuick
The W pattern is undeniably one of the most reliable and valuable setups for spotting bullish reversals in crypto trading. It’s a powerful signal that, when correctly identified and traded with discipline, can open doors to significant opportunities. It transforms the often-chaotic crypto market into a landscape of discernible signals.
But identifying the pattern is just the first step. Executing successful trades requires robust tools, real-time data, and a platform that supports your analytical journey. MEXQuick provides all the cutting-edge tools and analytics needed to recognize, confirm, and execute W pattern trades confidently. From advanced charting capabilities to risk management features and innovative trading models, we equip you to trade smarter, not just harder.
Ready to master chart patterns like the W pattern and elevate your crypto trading game? Start trading smarter today


